Climate Change and Air Pollution Management
Importance and Mission
The significance of climate change mitigation and resilience for the Group is directly linked to the efficiency, stability, and sustainability of its renewable energy operations. As a company focusing on solar, wind, and biomass energy, the Group must manage both transition risks and physical risks. Effectively addressing climate-related risks will enhance business resilience, ensure compliance with regulations, and build stakeholder confidence. The Group recognizes that climate change is not only an environmental and societal challenge but also an urgent business priority. With a strong commitment to sustainable business practices, the Group integrates climate change considerations into its core operations, aligning with global efforts to reduce impacts and transition to a low-carbon future.
SDGs in the Climate Change
and Air Pollution Management
and Air Pollution Management
Goals and Performance Highlights
Goals

Enhancing Climate Adaptation Capacity –Developing infrastructure and risk mitigation strategies to effectively address extreme weather events and long-term climate impacts.

Aligning Strategies with Global Climate Goals – Adopting frameworks such as Science-Based Targets (SBTi), TCFD, and Net-Zero Commitments to ensure compliance with regulatory frameworks and meet stakeholder expectations.
Fostering Collaboration with Stakeholders – Partnering with governments, industries, partners, suppliers, and local communities to accelerate the transition to a low-carbon economy and contribute to international climate efforts.
Performance Highlights 2025
| Greenhouse gas emissions | HO | SPN | WVO | SN | UPT | WINCHAI | SEG 1/ | TGC | TTQN | SSE 1/ | TTTV | Total Year 2025 | |
|---|---|---|---|---|---|---|---|---|---|---|---|---|---|
| Direct Greenhouse Gas Emissions of the Organization Scope 1 (Unit: tCO2e) | |||||||||||||
| Stationary Combustion | 0 | 0 | 0 | 14.36 | 4,364.41 | 0 | 0 | N/A | 0.55 | 0 | N/A | 4,374.32 | |
| Mobile Combustion | 37.53 | 0 | 0 | 18.12 | 1.56 | 0 | 0 | 19.18 | 2.64 | 0 | N/A | 79.52 | |
| Fugitive (Leakages and Others) - Fire suppressant CO2 - Methane emission from septic tank |
5.94 | 5.16 | 0.73 | 0.55 | 5.15 | 1.99 | 0 | N/A | N/A | 0 | N/A | 24.02 | |
| Scope 1 Greenhouse Gas Emissions- Thailand | 4,455.50 | ||||||||||||
| Scope 1 Greenhouse Gas Emissions- Overseas | 22.37 | ||||||||||||
| Total Scope 1 Greenhouse Gas Emissions | 4,477.87 | ||||||||||||
| Performance in Reducing Scope 1 Greenhouse Gas Emissions Compared with 2024 | ▼ 35.2 Decrease due to lower fuel consumption for electricity generation at the UPT project | ||||||||||||
| Indirect Greenhouse Gas Emissions from Energy Consumption – Scope 2 (Unit: tCO2e) | |||||||||||||
| Electricity Consumption | 15.42 | 245.22 | 8.75 | 2.18 | 56.39 | 264.17 | 328.55 | 0 | 339.96 | 0 | 372.78 | 1,633.42 | |
| Scope 2 Greenhouse Gas Emissions - Thailand | 592.13 | ||||||||||||
| Scope 2 Greenhouse Gas Emissions - Overseas | 1,041.29 | ||||||||||||
| Total Scope 2 Greenhouse Gas Emissions | 1,633.42 | ||||||||||||
| Performance in Reducing Scope 2 Greenhouse Gas Emissions Compared with 2024 | ▼ 134.62 Decrease due to lower electricity consumption at the TTQN project | ||||||||||||
| Other Indirect Greenhouse Gas Emissions – Scope 3 (Unit: tCO2e) | |||||||||||||
| Energy and fuel consumption by subcontractors for electricity production and maintenance activities | 0 | 0 | 0 | 0 | 321.35 | 0.27 | N/A | N/A | N/A | N/A | N/A | 321.62 | |
| Business air travel | 42.59 | 0 | 0 | 0 | 0 | 0 | N/A | N/A | N/A | N/A | N/A | 42.59 | |
| Employee commuting using private vehicles | 82.6 | 10.6 | 5.17 | 0 | 4.56 | 10.16 | N/A | N/A | N/A | N/A | N/A | 113.09 | |
| Municipal water consumption | N/A | 0.61 | 0 | 0.03 | 29.03 | 0.2 | 0 | 0 | 0 | 0 | 0.26 | 30.13 | |
| Paper Consumption | N/A | N/A | 0.01 | 0 | 0.21 | N/A | N/A | N/A | N/A | N/A | N/A | 0.22 | |
| Scope 3 Greenhouse Gas Emissions - Thailand | 507.39 | ||||||||||||
| Scope 3 Greenhouse Gas Emissions - Overseas | 0.26 | ||||||||||||
| Total Scope 3 Greenhouse Gas Emissions | 507.65 | ||||||||||||
| Performance in Reducing Scope 3 Greenhouse Gas Emissions Compared with 2024 | ▼ 133.4 Decrease due to operational restructuring at the SPN project, with O&M services transitioned in-house | ||||||||||||
| Total Revenue (million baht) | 3,146.40 | ||||||||||||
| Ratio of Greenhouse Gas Emissions Scope 1 & 2 per Unit of Electricity Generation (Unit: tCO2e per megawatt-hour) | 0.0091 | ||||||||||||
| Ratio of Greenhouse Gas Emissions Scope 1 2 &3 per Unit of Electricity Generation (Unit: tCO2e per megawatt-hour) | 0.0099 | ||||||||||||
| Ratio of Direct and Indirect Greenhouse Gas Emissions (Scope 1 and Scope 2) per Total Revenue of the Group (tCO2e per million baht) | 1.9 | ||||||||||||
| Ratio of Direct and Indirect Greenhouse Gas Emissions (Scope 1 Scope 2 and Scope 3) per Total Revenue of the Group (tCO2e per million baht) | 2.1 | ||||||||||||
Note:
1/ Greenhouse gas (GHG) emissions data from the SEG and SSE projects are excluded from this table, as these assets fall under the responsibility and reporting scope of the Operation and Maintenance (O&M) contractors to avoid double counting.
Management Approach
Climate Change
The Group's operational approach focuses on two key areas: managing Transition Risk by adapting to evolving policies, technologies, and market dynamics, and managing Physical Risk through robust infrastructure and environmental strategies under the theme of “Preserving the Environment” to mitigate the impacts of extreme weather events and shifting climate patterns. The Group prioritizes innovation and fosters collaboration with partners, stakeholders, and relevant parties to drive positive change. By delivering renewable energy solutions, the Group is committed to creating a sustainable future for all, through continuous strategic planning and development, with a focus on making a meaningful impact and contributing to the global shift toward sustainability.
Risk Assessment of Climate Change Impact on Business Operations and Risk Mitigation Approaches/Measures

The Group conducts a comprehensive assessment of climate change risks that may impact business operations by identifying and evaluating both Transition Risks and Physical Risks. This assessment process is aligned with global climate frameworks such as the Nationally Determined Contributions (NDCs) and the 2°C Scenario (2DS) of the International Energy Agency (IEA), in order to strengthen strategic resilience in addressing climate-related threats.
The key elements of this process involve clearly defining roles and responsibilities within the climate governance structure. The Board of Directors holds ultimate responsibility for overseeing the management of climate-related risks and opportunities, ensuring that these issues are appropriately integrated into the organization’s strategic decision-making processes. The Board regularly reviews climate risk reports and sets long-term objectives to support the Group’s sustainability mission.
To support the oversight role of the Board of Directors, the Group has established a Risk Management Committee (RMC) comprising senior executives. The committee is responsible for monitoring, assessing, and managing climate-related risks across the organization. This includes evaluating the potential impacts of policy and regulatory changes, market dynamics, technological advancements, and both acute and chronic physical risks affecting the Group’s value chain. The RMC integrates these climate-related risks into the Group’s Enterprise Risk Management (ERM) framework and submits regular reports to the Board of Directors to ensure that risk responses are aligned with the Group’s sustainability goals and climate strategy.
Additionally, senior executives in key departments such as Business Development, Operations, Procurement, and Sustainability play a crucial role in implementing climate risk mitigation strategies and identifying new opportunities related to the energy transition. Each department plays an important role in driving the Group's adaptation strategy, including investments in climate-resilient infrastructure, low-carbon technologies, and renewable energy innovation.
Carbon and Emission Reduction
To achieve Net Zero Emissions by 2050 and Carbon Neutrality by 2030, the Group adopts a comprehensive strategy, including renewable energy expansion, energy efficiency enhancement, carbon offsetting projects, and sustainable operational practices. Key approaches include:
01
Reduce operational greenhouse gas emissions (Scope 1 & 2) by 50% by 2035 – Improve energy efficiency by upgrading to high-efficiency machinery, utilizing Carbon Capture and Storage (CCS) technology, studying carbon sequestration in soil, and atmospheric carbon absorption.
02
Reduce emissions from supply and value chains (Scope 3) by 30% by 2040 – Collaborate with suppliers and partners to reduce greenhouse gas emissions by encouraging sustainable material usage, low-carbon transportation, renewable energy, optimizing low-carbon transport systems through electric vehicles, hydrogen, biofuels, and applying circular economy principles by recycling solar panels, wind turbine blades, and biomass materials to reduce emissions from materials and waste.
03
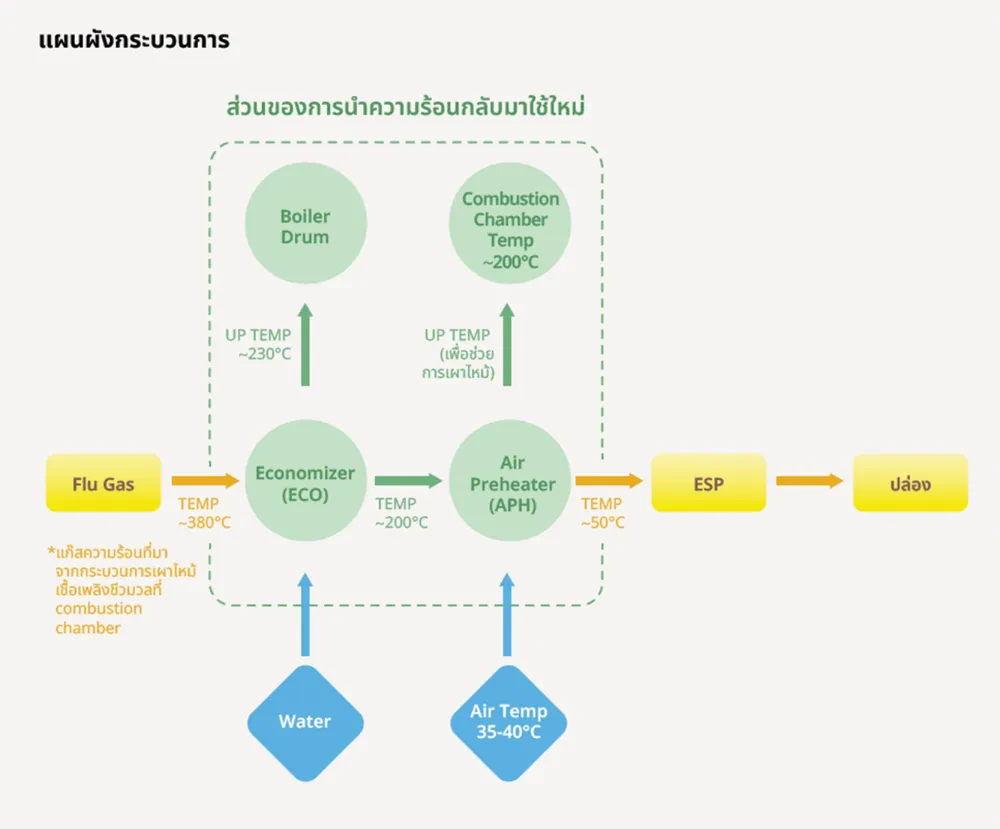
Reduce greenhouse gas emissions intensity per production volume by 40% by 2035 – Enhance power plant efficiency to increase energy production while emitting fewer greenhouse gases and employ heat recovery technologies, using excess heat from biomass power plants to reduce fuel usage.
04
Increase transparency, compliance with standards, and access to green financing – Adhere to international climate standards including Science-Based Targets (SBTi), TCFD, ISO 14064 (GHG emissions calculations), and transparently disclose information through clear, verifiable GHG and ESG performance reports to build investor confidence.
Pollution Control and Environmental Stewardship
To ensure effective air pollution control in alignment with international environmental standards, the Group has established the following key operational approaches:
01
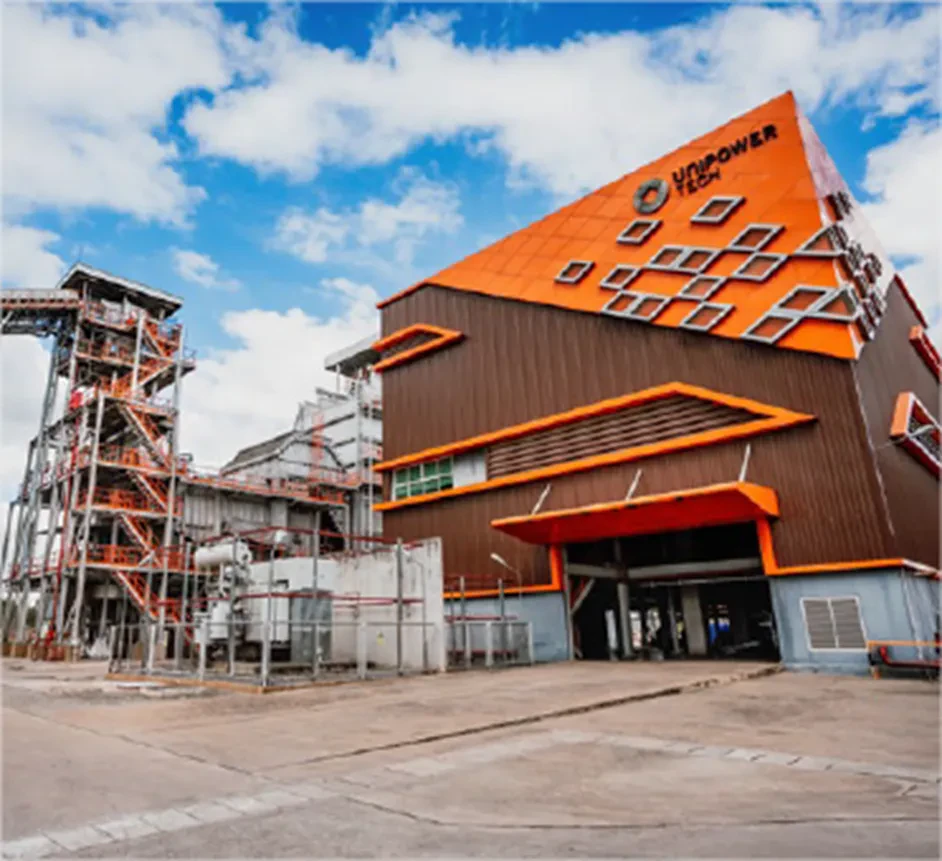
Pollution Control Technologies: Install air filtration and pollutant capture systems such as Electrostatic Precipitators (ESP) at biomass power plants (e.g., UPT) to reduce airborne toxins and particulates.
02
Compliance with Environmental Standards: Follow national and international air pollution standards (e.g., WHO air quality standards, ISO 14001). Conduct regular emission reporting and implement mitigation to maintain emission levels below regulatory thresholds. Control combustion temperature and select low-emission feedstock materials.
03
Continuous Air Quality Monitoring: Implement Continuous Emission Monitoring Systems (CEMS) to track emissions in real-time, enabling prompt corrective action. Monitor ambient air quality near power plants and communities to ensure no harmful impact.
04
Stakeholder Engagement: Collaborate with government, environmental agencies, and communities to propose pollution reduction solutions and promote clean energy. Educate staff and the public on air pollution prevention and impact mitigation.
05
Wind Turbine Noise Control Ensure wind turbine noise levels remain under 70 dBA in accordance with WHO guidelines. Turbines are installed at least 300 meters from residential areas, resulting in noise levels around 43 dBA, which is safe for human hearing.
Wind Turbine Noise Data – Winchai Project, Mukdahan Province
Noise measurements were conducted on 24–25 December 2025 at eight stations: Multipurpose Building (A), Monk Quarters (B), Temporary Monk Quarters (C), Holiday Residence Area (D), Ban Lup Pueng, Wat Phu Yang Diao, Ban Nong Nok Khian, and Ban Romklao.
The noise monitoring results are presented across four key sound level indicators:
- Leq 24 hr: Average sound level over a 24-hour period
- Lmax: Maximum recorded sound level
- Ldn: Day-Night Average Sound Level
- L90: Background noise level
| Station | Noise Measurement Results (dBA) | |||
|---|---|---|---|---|
| Leq 24 hr | Lmax | Ldn | L90 | |
| 1. Multipurpose Building (Point A) | 47.2 | 74.5 | 53.6 | 44.5 |
| 2. Monk Quarters (Point B) | 48.2 | 85.1 | 52.9 | 43.5 |
| 3. Temporary Monk Quarters (Point C) | 52.3 | 90.4 | 60.3 | 50.5 |
| 4. Holiday Residence Area (Point D) | 56.5 | 80.6 | 61.4 | 53.1 |
| 5. Ban Lup Pueng, Village No. 1 | 52.1 | 93.1 | 59.6 | 45.1 |
| 6. Wat Phu Yang Diao, Romklao Subdistrict | 50.6 | 86.7 | 57.9 | 46.8 |
| 7. Ban Nong Nok Khian, Village No. 4 | 48.6 | 77.6 | 51.7 | 52.3 |
| 8. Ban Romklao, Village No. 2 | 51.7 | 78.0 | 58.7 | 45.7 |
| Standard | 70 | 115 | - | - |
Note: *Standard based on National Environmental Board Notification No. 15 (B.E. 2540): Leq 24 hr ≤ 70 dBA, Lmax ≤ 115 dBA
Noise Data from the Biomass Power Plant Project of Uni Power Tech Co., Ltd. (UPT), Nakhon Ratchasima Province
Noise measurements were conducted on 6–7 December 2025 at five monitoring stations: Factory Fence (School Side – Thanon Kot), Factory Fence (Wat Nong Ree Wanararm Side), Factory Fence (Sikhio Community Side), Ban Thanon Kot School, and Wat Nong Ree Wanararm.
The noise monitoring results are presented across five key sound level indicators:
- Leq 24 hr: Average sound level over a 24-hour period
- Lmax: Maximum recorded sound level
- L90: Background noise level
- Maximum noise level during daytime (06:00–22:00 hrs)
- Maximum noise level during nighttime (22:00–06:00 hrs)
| Station | ผลการตรวจวัดเดซิเบล (เอ) | ||||
|---|---|---|---|---|---|
| Leq 24 hr | Lmax | L90 | Maximum noise level during daytime (06:00–22:00 hrs.) | Maximum noise level during nighttime (22:00–06:00 hrs.) | |
| 1. Fence line adjacent to Sikhio community | 54.8 | 60.9 | 52.4 | - | - |
| 2. Fence line adjacent to temple area | 46.5 | 74.3 | 40.8 | 5.6 | 9.1 |
| 3. Fence line adjacent to school area | 50.8 | 61.6 | 37.3 | 2.4 | - |
| 4. Ban Thanon Kot School | 47.8 | 61.1 | 44.6 | 1.4 | 1.7 |
| 5. Wat Nong Ree Wanararm | 46.7 | 67.3 | 42.3 | - | 4.7 |
| Standard | 70 | 115 | - | 10 | 10 |
Note: Thai Standard The noise standards refer to the Notification of the National Environmental Board No. 15 (B.E. 2540), which specifies that Leq 24 hr shall not exceed 70 dB(A) and Lmax shall not exceed 115 dB(A), and the Notification of the National Environmental Board No. 17 (B.E. 2543), which stipulates that noise disturbance shall not exceed 10 dB(A) above the background noise level.
Air Emission Inventory (SOx, NOx, and PM) – Biomass Power Plant Project, Uni Power Tech Co., Ltd. (UPT), Nakhon Ratchasima Province
Air quality monitoring results from a single stack using CEMS under normal operating conditions and soot blowing conditions, conducted on 6 December 2025. The monitored parameters include total suspended particulates (TSP), nitrogen oxides as nitrogen dioxide (NOx as NO2), sulfur dioxide (SO2), carbon monoxide (CO), and opacity.
| Details | Units | Monitoring Results from Boiler Stack 45 Tons (Normal Operation) | Monitoring Results from 45-Ton Boiler Stack (Soot Blowing Operation) | Standard 1/ |
|---|---|---|---|---|
| 6 December 2025 | 6 December 2025 | |||
| Fuel Type | - | Biomass | Biomass | - |
| Total Suspended Particulate Matter (TSP) | milligrams per cubic meter (mg/m3) | 1.787 | 6.487 | 120 |
| Nitrogen Oxides (NOx) | ppm | 86.097 | 79.683 | 200 |
| Sulfur Dioxide (SO2) | ppm | <0.001 | <0.001 | 60 |
| Carbon Monoxide (CO) | ppm | 239.466 | 220.625 | 690 |
| Opacity | % | 5 | 9.8 | 10 2/ |
Note:
- 1/ Standard: Notification of the Ministry of Natural Resources and Environment on Emission Standards for New Power Plants B.E. 2553 (2010), referring to allowable concentrations of air pollutants from biomass fuel combustion. Results are calculated at 1 atmosphere (760 mmHg) and 25°C under dry basis conditions, with 50% excess air or 7% excess oxygen in combustion gases.
- 2/ Standard: Ministry of Industry Notification on Smoke Density Limits for Boiler Stack Emissions in Factories B.E. 2549 (2006).
ผลการคำนวณปริมาณการปล่อยมลสาร (ตัน)
| Year | SO2 | NO2 | PM | |||
|---|---|---|---|---|---|---|
| Emission Quantity (tons) | Intensity (kg/MWh) | Emission Quantity (tons) | Intensity (kg/MWh) | Emission Quantity (tons) | Intensity (kg/MWh) | |
| 2024 | 0.95 | 0.0127 | 110.14 | 1.47 | 38.41 | 0.51 |
| 2025 | 0.50 | 0.0067 | 132.41 | 1.78 | 22.08 | 0.30 |
Note: As the Company’s power generation activities are primarily based on solar and wind energy, which do not produce emissions during the generation process, the data in this table is limited to the UPT project (biomass power generation) only.